Moldable Emacs: keep an eye on those test performance!
Too long; didn't read
Quick feedback is essential to enjoy learning. Here I show how we can view how fast our unit tests are (in Clojure, although also I used this also for Scala (and I guess Java works fine too)).
The problem
I read somewhere that surgeons feel their job is the best ever. During a surgery, any action they take changes the health of their patient. If they succeed, the patient lives. If they fail, the patient dies. The result of their action is always visible to them. When they fail, they learn instantly.
In software that should be similar. For example, when I program I test my ideas in a REPL. In that case, the computer shows in an instant when something is wrong. When I work on systems, I write test cases, and I am usually as happy as surgeons.
It happens often though that we keep adding tests to be confident about correctness. The we pass an invisible tipping point and our feedback becomes slow.
This slowness happens so often that Benji Weber felt like summarize his ideal latency times.
How cool would it be if we could see the test performance to ensure we keep them fast enough?
And there is a solution
Moldable development to the rescue! Here we want to view the performance of test cases. Our aim is to see when a test takes too long to run.
Let me show first where we will get to with a picture.
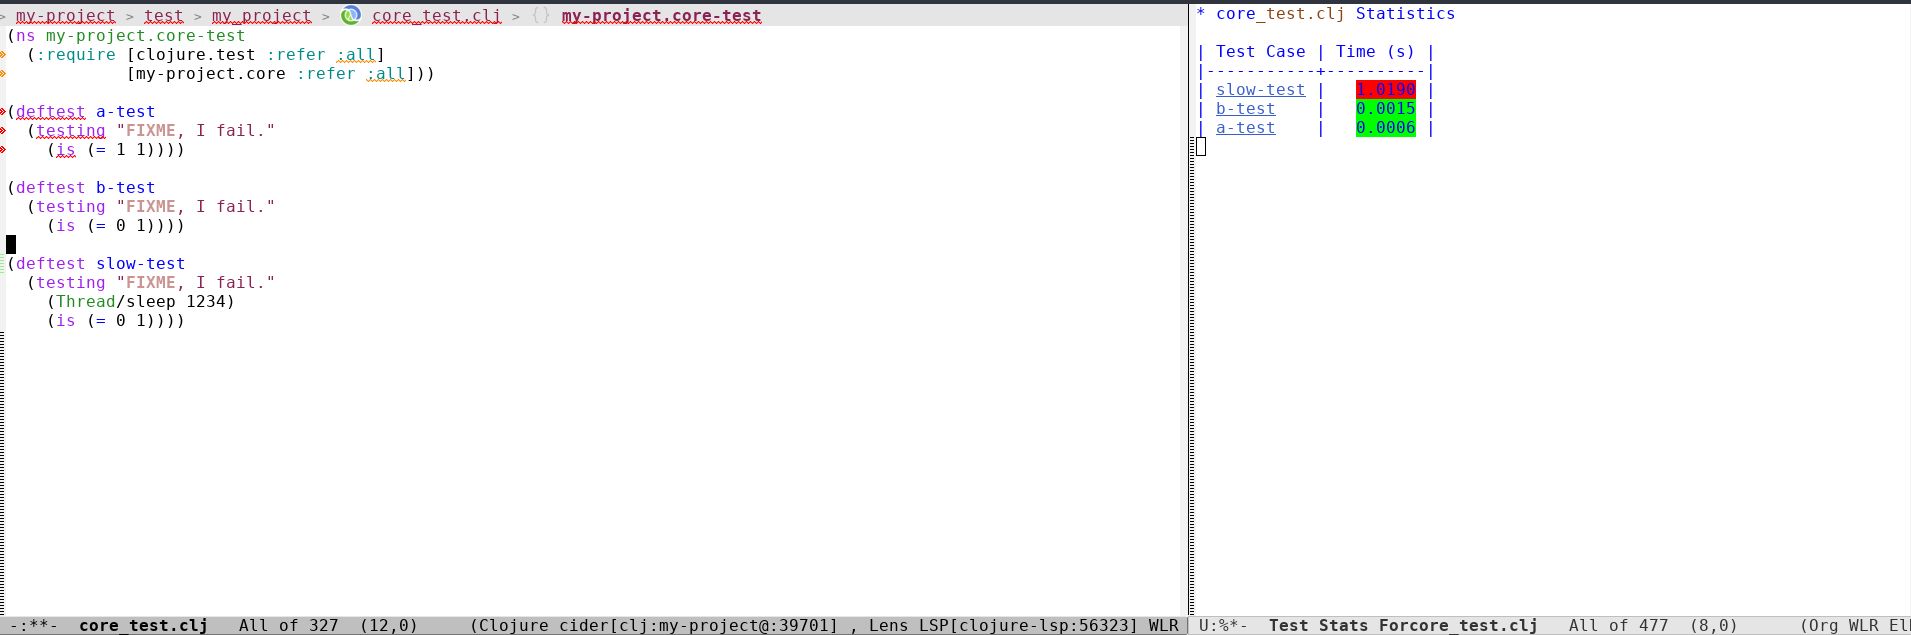
In the above picture you see that we have a Clojure test file and a
buffer with some timing stats. Note that the slow-test is in red. In
the code of that test I added a second of delay on purpose. The mold I
built shows me that information immediately via an Org table.
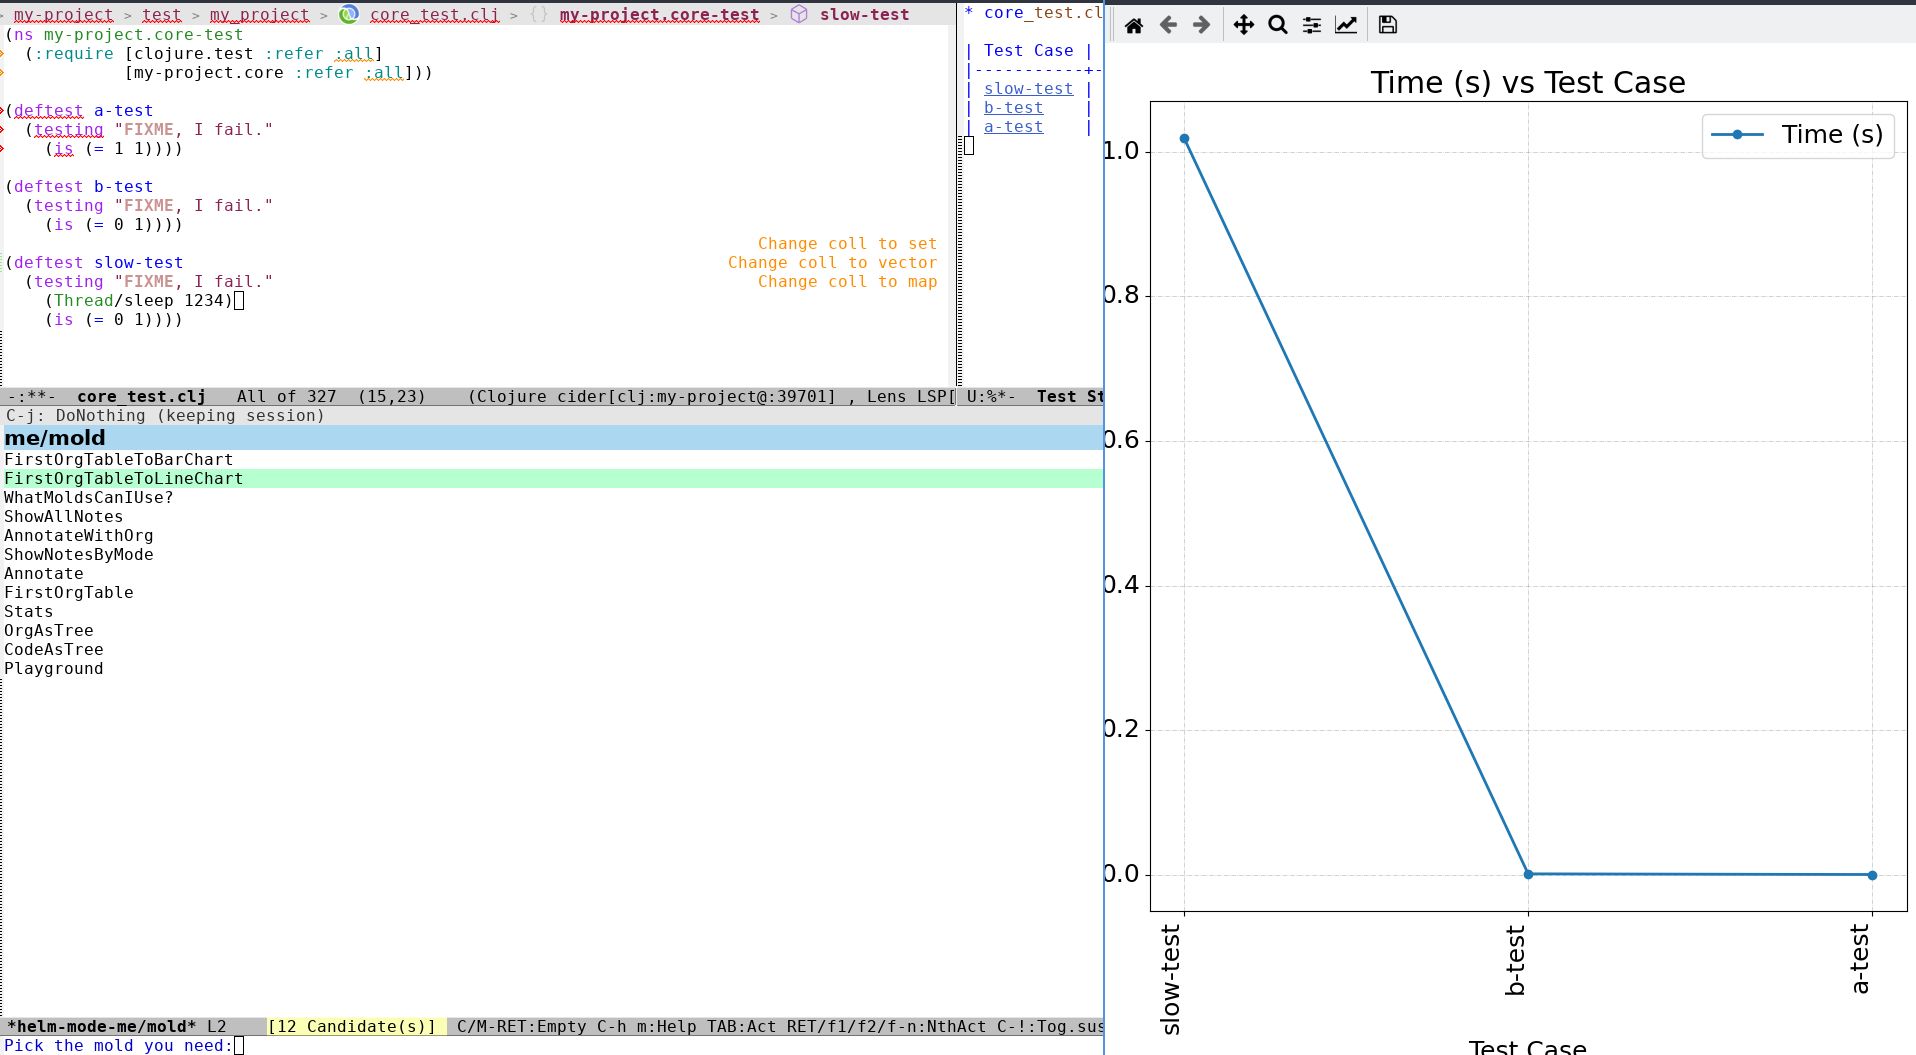
Now the moldable folks may think: "Cannot we make that even more immediate with some visuals?". Sure, here comes another picture.
Let me explain now. As I wrote about in my vision blog, molds should compose well to achieve amazing things.
The first picture shows you a mold that takes a test file (with test stats in XML format in a /target/test-reports directory) and produces an Org Table. The second picture shows you a composite mold that takes an Org table and produces a graph (both bar and line charts are available, I am showing the latter).
The funny thing is that I did not plan to compose these molds. I just
called the me/mold interactive function to see what molds I had
available! The bar/line chart gives a much better intuition to me of
how much slower is slow-test than the other tests.
(Indeed, there is a mold for visualizing a CSV buffer as graphs. The mold to graph Org tables is something I created because I knew that Org tables can easily be translated to CSV and I liked the idea to make graphs out of my tables.)
Still the coloring of the table by time helps in a quick evaluation of
test speed. Note that you can also navigate the cells of the Test
Case column to go to the test definition. This is useful to me when I
have a lot of test cases available.
If you want to try this with Clojure, all you have to do is to run the following.
lein new app my-app
Change the project.clj in the my-app folder as follows.
(defproject my-project "0.1.0-SNAPSHOT"
  :description "FIXME: write description"
  :url "http://example.com/FIXME"
  :license {:name "EPL-2.0 OR GPL-2.0-or-later WITH Classpath-exception-2.0"
            :url "https://www.eclipse.org/legal/epl-2.0/"}
  :dependencies [[org.clojure/clojure "1.10.0"]]
  :main ^:skip-aot my-project.core
  :target-path "target/%s"
  :test2junit-output-dir "target/test-reports" ;; we need this!
  :profiles {:uberjar {:aot :all}
             :dev {:plugins [[test2junit "1.4.2"]]}}) ;; we need this!
This is adding the test2junit plugin which makes Leiningen produce XML reports in JUnit style. Then you just have to produce the XML stats.
lein test test2junit
If you now visit the core_test.clj file and call me/mold, you
should see the mold you need.
Let's get in the details now!
The function that decides how to color the Org table cells is the following.
(defun me/highlight-unit-test-time (time-as-string)
  "Highlight TIME-AS-STRING according to unit tests."
  (and (ignore-errors (string-to-number time-as-string))
       (let* ((time (string-to-number time-as-string))
              (color (cond
                      ((>= time (/ 10.0 1000)) "red")
                      ((>= time (/ 2.0 1000)) "orange")
                      ('otherwise "green"))))
         (me/color-string time-as-string color))))
The cond defines the cases. I am assuming that our total time budget
is 100 milliseconds, following Benjamin's suggestions. So, if a test
uses a tenth of the whole budget or more I mark it in red (because I
usually write more than 10 tests per file). I guessed I should start
worrying if a test goes over 2 milliseconds. Then it would show in
orange.
For the curious, me/color-string is a hack that colors (inserted)
string background even in Org tables.
(defun me/color-string (str color)
  (propertize
   str
   'display
   (propertize
    str
    'face
    (list :background color))))
And if you got so far in the post, I guess you can peek in the body of the mold as well.
(lambda ()
  (let* (...
         (self (with-file
                (me/find-relative-test-report (buffer-file-name))
                (libxml-parse-html-region (point-min) (point-max))))
         (testcases (esxml-query-all "testcase" self))
         (buffer (get-buffer-create (concat "Test Stats For" buffername))))
    (with-current-buffer buffer
      ...
      (me/insert-org-table
       `(...
         ("Time (s)" .
          (:extractor
           (lambda (obj) (--> obj
                           cdr
                           car
                           (alist-get 'time it)))
           :handler
           (lambda (s) (me/highlight-unit-test-time s)))))
       testcases)
      ...
      buffer)))
I have elided some code with .... I just want to show you that we
extract data from the XML stats in the let bindings for self and
testcases (BTW esxml is amazing). And that we make a table with
me/insert-org-table. That function may be useful to you if you ever
want to write a mold yourself. You just have to define a column name.
Then you can add an :extractor which extracts a string out of the
values (in this cases testcases which is a list of XML objects in a
s-expression format). I decided to have an :handler function for
clarity: this just modifies the string you extracted with
:extractor. In our case we just highlight the string with our
latency strategy.
With this little code we can immediately see that our tests are getting slow. This mold works at a file level.
In the future, I want to make molds that operate at package/project/cluster-of-project level. That way you could see how slower the tests in a package are becoming. Or tests of a whole projects. Or even tests in a cluster of projects!
Once you can see that and have latency strategies in place, you can easily define and check architectural fitness functions with molds! (For an idea of how fitness functions happen in GlamorousToolkit you can look at this article.)
Conclusion
This shows you how amazing can molds make you focus on the information you need. If you are working on a project that can produce XML test stats in JUnit style, you can use this mold to show how slow your tests are. And you saw how easy is to compose molds to produce even more value. If you want to have a try but things do not work out, open an issue in the project. I am still working on documentation :)
Happy testing!
P.S.: the name of the mold is currently "TestRunningStats", although I think I should change names to become more readable soon. So do not cling to names yet, this project is too young!