Emacs as your code-compass: finding code hotspots
Too long; didn't read
Hotspots are the best tool to observe your code technical debt and smell modules that may contain bugs. In this post I show you how to use code-compass to make this analysis and explain how to interpret the analysis.
The problem
Say you start your software project. You organize your code in a elegant and simple way, and the product is successful. So successful that you cannot handle it by yourself. Now you hire some fellow developers. You take care of checking all their code to fit your standard. The product is even more successful: you hire more colleagues. Now you cannot check the code anymore and you must trust who you carefully hired. Your input would be much valuable when things go wrong, but at this point you may not be aware of it: lack of visibility!
Often you are the one joining and nobody has a complete understanding of the original structure of the code and the reasons things were done that way. Since change is unavoidable (that is the reason why you hire/are hired), well... you start changing the code anyway.
According to how you change an artifact, you make it easier or more difficult to change it further. Making it easier typically takes extra mental resources and effort.
Good engineers go for the sustainable option and also try to reduce any existing complexity whey they encounter it.
In my opinion that is a bit reactive and late. Ideally I would like to monitor via a high level and always updated view if the code is growing badly. In that way I can plan and prioritize my maintenance. Furthermore I would like to use the same analysis to evaluate my own work, and so make sure I do not make my code more complex with my changes.
It is a problem indeed
Software complexity relates to quantity of code and frequency of change. This means that if I keep frequently adding code to the same module, I am making it more difficult for a future reader to understand what it does. And if a reader struggles to understand what a module does, the reader also missed to find functional problems with my code.
A continuous extension of the same module may also show that I am giving too many responsibilities to it.
If I am not just extending it but rather modifying existing behavior, then it is also likely I am adding errors in the flow.
So even as a engineer worried about the quality of my design and the correctness of my features, I would like an overview of where complexity is accumulating.
And there is a solution
As I anticipated in my previous post, the "hotspot" analysis makes complexity easy to discover. Here a picture to get the idea:
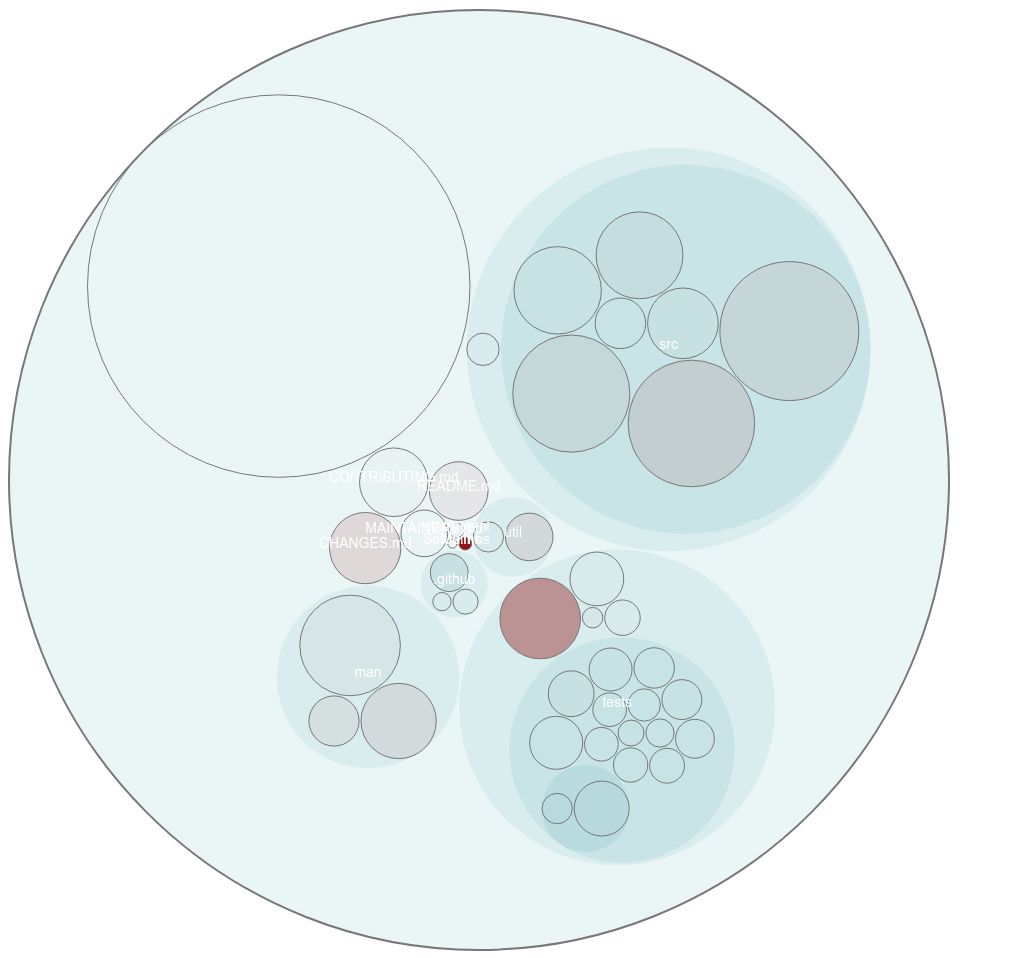
You will see a diagram with circle within circles. The biggest circle represents the repository and the included circles represent packages and modules. The empty circles, i.e. the modules, may be a shade of red. The redder the more often they have changed. The more they changed the more likely they contain quality problems. If these circles are also large then they likely have too many responsibilities because their code may have to change for different reasons.
The red circles are "hotspots", because they have suffered the highest frequency of change. A healthy codebase tends to have few hotspots and the size of its modules similarly small.
The example above represents the XMonad repository (a X window manager written in Haskell) and you can see in the bottom right a circle that is both red and bigger than other modules. That is the Operations.hs file that is about 700 lines and changed about 255 times from the beginning of the repository.
I have no idea of how XMonad works, but with this graph I have already a way to help maintainers handle their codebase complexity. Not only that, but I can explore the codebase structure without looking at a single line of code. Furthermore I can easily see where developers have been working lately (by reducing the scope of the analysis to the last week or month).
I found out that this picture is useful to share knowledge about software health with business people.
But let's get into the important bit: how can your Emacs produce that for you?
I assume you followed the installation instructions already and you just need to clone the latest version of the repository.
Next the following video shows how to use the c/show-hotpsots
command of code-compass:
You may notice that in the video I type "beginning", after selecting the root directory of the target repository. In that way I am saying to use the full history of the repository for the analysis. You can use TAB or your preferred completion system to show other options: in general you can set any number N of days or months ago with options looking like "Nd" or "Nm", for example to show the analysis of last week I would have typed "7d".
If you want to test this out in a fresh Emacs, you can save the
following snippet in /tmp/code-compass-minimal-setup.el (always
assuming you got external dependencies like Docker, code-maat, cloc,
etc...):
(require 'package)
(eval-and-compile
  (setq
   package-archives
   '(("melpa-stable" . "https://stable.melpa.org/packages/")
     ("melpa" . "https://melpa.org/packages/")
     ("marmalade"   . "https://marmalade-repo.org/packages/")
     ("org"         . "https://orgmode.org/elpa/")
     ("gnu"         . "https://elpa.gnu.org/packages/"))))
(package-initialize)

 ;;; Bootstrap use-package
;; Install use-package if it's not already installed.
(unless (package-installed-p 'use-package)
  (package-refresh-contents)
  (package-install 'use-package))
(setq use-package-always-ensure 't)
(require 'use-package)
(require 'diminish)
(require 'bind-key)
(use-package async)
(use-package dash)
(use-package f)
(use-package s)
(use-package simple-httpd)
At this point open a terminal in the code-compass repository and run:
emacs -Q -l /tmp/code-compass-minimal-setup.el -l code-compass.el
With a M-x c/show-hotspots you can pick any directory containing a
Git repository and generate your own interactive graph (it will ask
you ).
Welcome to the world of code analysis within Emacs!
Conclusion
In this post I showed how to make the first step in transforming Emacs in your code compass! Just clone the repository and start analyzing your Git repositories.
Sometimes soon I will introduce you to the code-compass command that makes hotspots snapshots of your repository so you can notice your hotspots evolution. And this is only about a single repository! Microservices hotspot analysis coming soon too.
Anyway, analyzing modules complexity via indentation is the next feature of code-compass for us: stay tuned!
Happy code-travelling!