JVisualVM, or how to observe the state of your Java Virtual Machine
Software engineers are very smart and do a lot of incredible work. Sometimes they also do errors of omission. Since I am an engineer too, I am prone to forget that the programs I write can cleanup for me until a certain point.
When we run a computation we typically create data that we store in some volatile memory. We got a stack, very small and fast, and a heap, very large and slightly slower.
If we overfill the stack with data, our software will complain by
crashing the application with the infamous StackOverflowError:
def letsStackOverflow (list: List[Int]): Int =
  list match {
    case Nil => 0
    case x::xs => x + letsOverflow(xs)
  }

letsStackOverflow(1 to 10000 toList)
java.lang.StackOverflowError
...
Now the heap is another kind of beast. It is supposed to hold quite
some data, so filling it will take time: your application will crash
for lack of resources over time. Let's get a OutOfMemoryError for
completeness:
import scala.util.Random

var listOnHeap: List[String] = List()

def letsHeapOverflow (list: List[Int]): Unit =
  list.foreach(_ => listOnHeap = s"someStringThatTakesHeapSpace_${Random.alphanumeric take 10 mkString}"::listOnHeap)

letsHeapOverflow(1 to 10000000 toList)
java.lang.OutOfMemoryError: Java heap space
In this example we willingly tried to fill up the heap as fast as possible. In real world scenarios this happen quite more slowly, creating subtle bugs that require very expensive hunting sessions.
Our hound when we are blindly looking for the bug in a Java Virtual
Machine application is JVisualVM. It comes with your installation, so
you can just fire it up by running jvisualvm in the terminal.
JVisualVM will pick up any processes that are using the virtual machine. So if you try to run the Scala code snippets above in a shell like Ammonite, you will see the ammonite process appearing in there.
If you click on this process, you will land on the overview for the process:
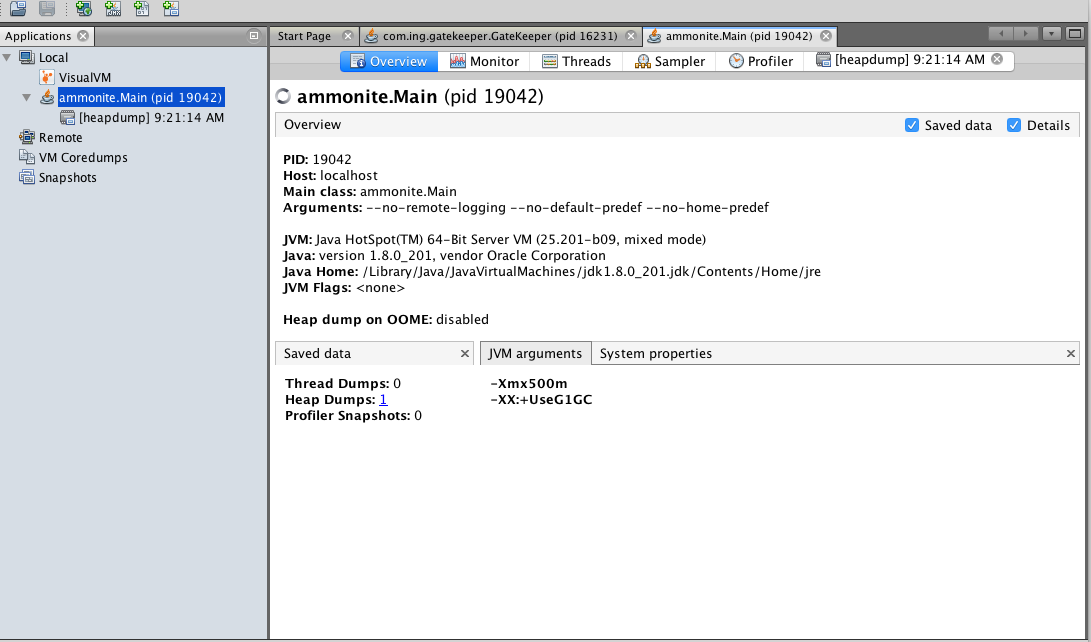
The information we are looking for is in the next view "Monitor":
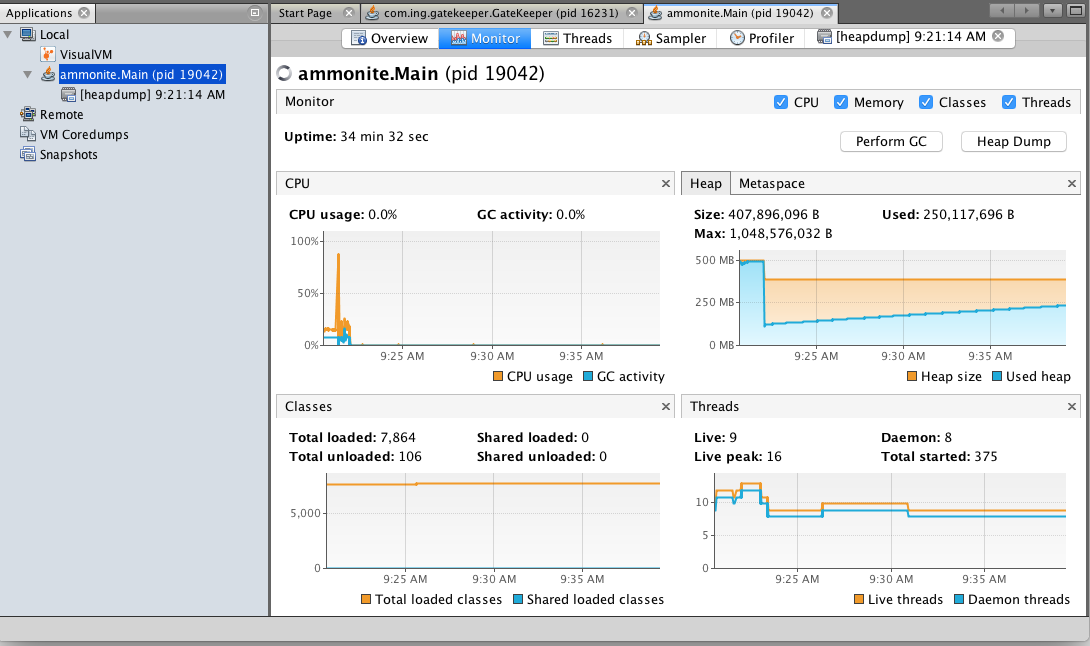
In this view you can see how the heap grows on the top-left diagram.
The other tool you want to look at is "Heap Dump" button. By pressing you obtain a detailed snapshot report for what the heap contains:
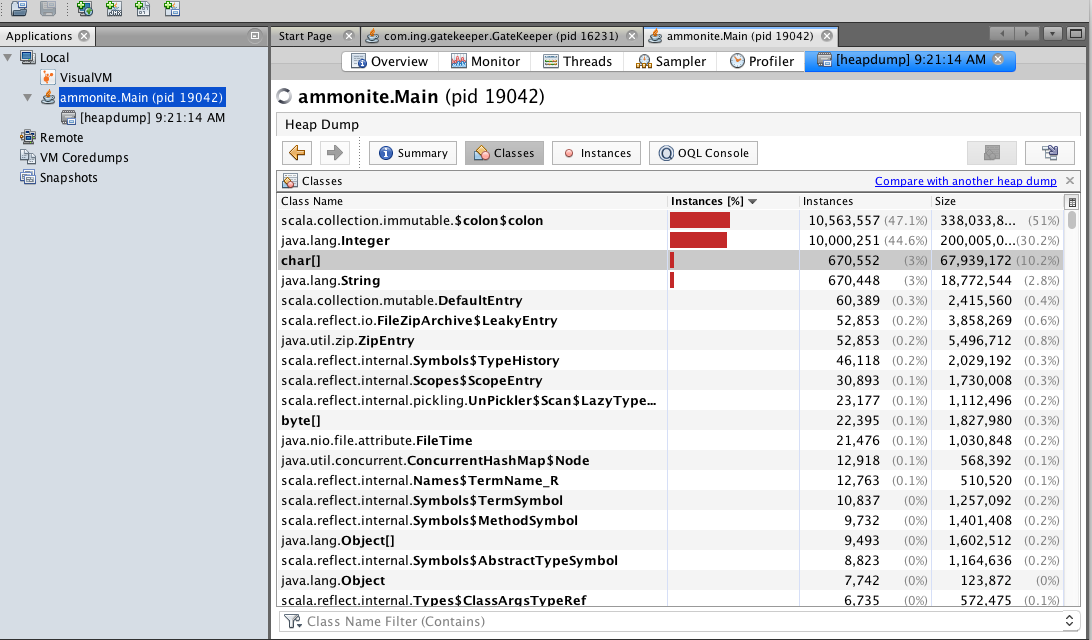
You will see that for our run of heapOverflow we have quite few
strings, integer and colons. With this clue is at least easier to find
which part of the code is causing the failure.
The usual next step is to println around until you find the problem.
Hope this will help your bug hunts.
Happy coding!